Quick Poll: How long to sprint?
08-05-2008Quick Poll Results: Sprint Duration
15-05-2008Over the last few days, there has been a discussion on the scrum mailing list on whether scrum provides a good overview of the entire architecture and whether it’s possible to know whether the project is on course to meet its short term and long term goals.
There are three questions here:
- What will the system do? (Functionality)
- How with the team implement the system? (Tasks)
- How will the features of the system be realized? (Architecture)
Under Scrum, the product backlog answers question 1 and only question 1. The product backlog is nothing other than a proposed feature list with an estimated effort and a priority associated with each feature.
The features are usually defined as “user stories” such as “a job hunter can upload his resume to the site to speed up applying for advertised jobs”. Who wants it? What can he do? Why does he want it? As you get closer to implementing a particular story you may have to break it up into smaller stories, so the team can actually implement the individual functions in the course of one sprint. The fundamental message is that the team is delivering working functionality every month. The functionality may be a very small increment, but it is working and tested and of production quality.
The priorities define what the customer would like to have next.
So: you negotiate work between team and product owner purely on the basis of what the system will do. You also measure progress based on how much of the needed functionality has actually been implemented.
How do you measure progress? At the beginning of the project, sum the estimates for all the functionality required. At the end of each sprint, deduct the estimates for the functionality actually completed (adjust as well for changes in scope which were caused by adding, removing or reestimating stories). Do not deduct anything for work partially completed (not done) or for work with does not provide actual functionality (e.g. a design document). Graph the estimated remaining effort as a function of time. This is the burn down chart. If you keep the sprint length constant, the slope of the chart (your velocity) will validate your estimate for the time needed to complete the project. Expressed mathematically:
- estimatedSprintsRemaining = roundUp(functionalityRemaining / functionalityAccomplishedProSprint) ; 0 )
- estimatedTimeRemaining = estimatedSprintsRemaining * sprintDuration
If your estimates are right and you scope is constant, then estimatedSprintsRemaining should decrease by one every sprint. If not, there is a problem, and the product owner and scrummaster need to deal with it.
So you see, at the planning and controlling level, we don’t talk about “tasks” at all, only functionality.
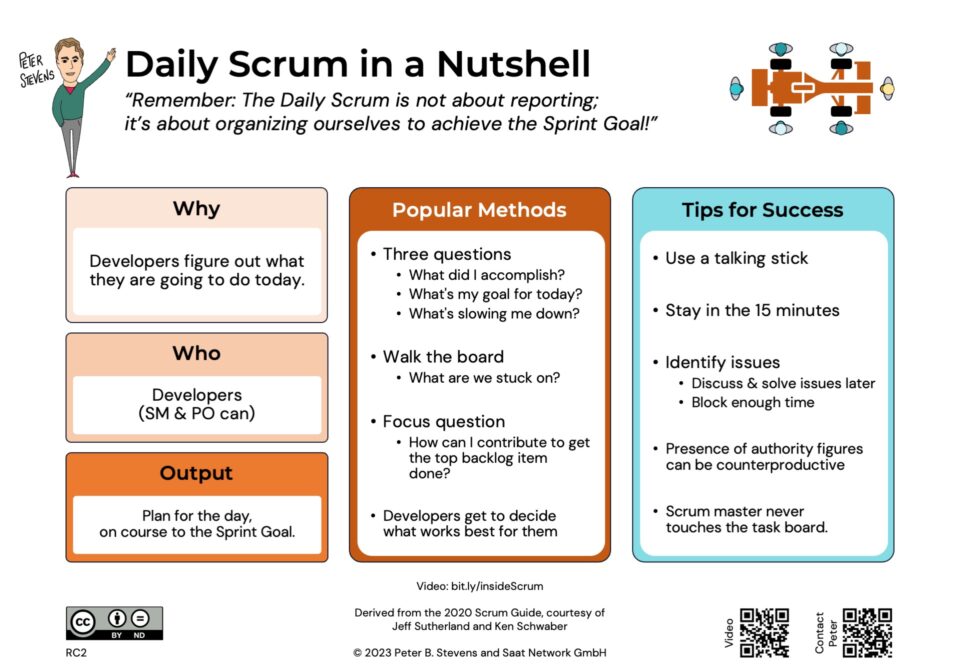
Question 2 is the responsibility of the team.
At the start of each sprint, the team commits to a set of functions to be implemented by the end of the sprint. As a first step, the team decides what has to be done to implement the agreed upon functionality. This is a list a of tasks and each task is estimated in hours. The estimate at the user story level is usually more abstract. This estimate is updated daily. How much work is remaining (how much has been invested is not relevant!). This is also graphed daily to produce the sprint burn down chart. The slope of this graph tells you whether the team expects to complete all the functionality of the current sprint.
Question 3 is also the responsibility of the team, but the level of quality you need to achieve depends on the larger goals of the system and is best agreed on with the product owner at the beginning of the project. If the system has an expected life of more than 6 months or so, the architecture will have to grow and change over time. Your engineering practices must support that. Otherwise your test and maintenance costs explode, and after a few years, the system is no longer maintainable and you have to build something new. (Explaining this to customers outside the IT branch can be difficult!).
Implementing architectural changes is called refactoring and being able to refactor reliably is an essential engineering discipline. To do this effectively requires extensive automated test suites — “as-built documentation” — not extensive blueprints written before anybody wrote a line of code.
Project Overview with Scrum
So with through the Product Burn Down chart we review progress toward the overall goals, and with the Sprint Burn Down chart we evaluate progress to the immediate goals on a daily basis. Taken together, these two charts forecast whether the project goals will be met.
A detailed architecture specification at the beginning is not helpful. The architecture needs to adapt over time. So keeping it minimal and flexible is usually advantageous.
